Failures don’t happen without warning. Most equipment sends subtle signals of trouble long before breaking down completely. The key to avoiding downtime and costly repairs is knowing how to spot these early signs and act on them in time.
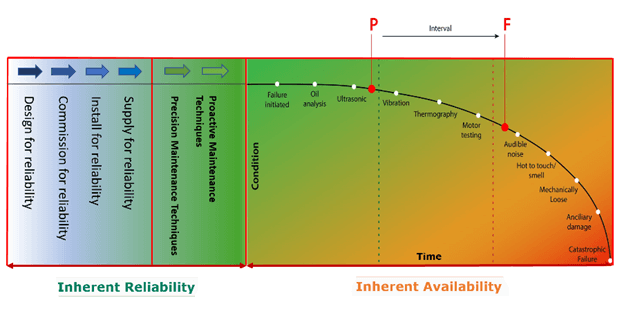
The P-F curve is the tool maintenance professionals rely on to do just that. By mapping the timeline from potential failure (P), the point where issues start to appear, to functional failure (F), when the equipment can no longer perform its job, the P-F curve helps teams focus their efforts where they’re needed most.
Here’s are some quick definitions to help you understand the key concepts:
- Potential failure (P): The earliest point when an issue becomes detectable.
- Functional failure (F): When an asset can no longer perform its intended function.
- P-F interval: The time between P and F, offering a window to plan and execute maintenance.
- Inherent reliability: Located to the left of the P-F curve, inherent reliability is the probability that an asset will operate without failure under certain conditions.
- Inherent availability: Located to the right of the P-F curve, inherent availability is the probability that a system will be operating properly — within the limits of its inherent design, maintained through corrective actions — when it’s requested for use.
Think of the P-F curve as a timeline for asset health. At the beginning, your equipment starts with full resistance to failure. Over time, wear and tear cause this resistance to decline. The curve itself visualizes this process. The Y-axis shows resistance to failure, or how far a component is from breaking down. The X-axis tracks age or time, representing how resistance diminishes as the asset is used. Together, these dimensions highlight the asset’s condition over its lifespan and help you predict when intervention is needed.
However, it’s important to recognize right off the bat that no amount of maintenance performed on the P-F curve will increase an asset’s inherent reliability. This trait is defined by the design, installation, commissioning, and supply chain processes — everything that happens before the asset goes into operation.
Instead, maintenance on the P-F curve focuses on availability. Availability ensures that assets perform reliably within the limits of their inherent design. Every action taken within the P-F curve — whether predictive, preventive, or reactive — is corrective in nature. The goal of this corrective work is simple: to bring the asset as close as possible to its original resistance to failure.
This makes the P-F curve vital for informing smart, well-timed maintenance decisions.
Three Ways to Use the P-F Curve to Improve Maintenance
Effective maintenance depends on good timing and using the right approach for the right assets. Here are three guiding principles for using the P-F curve to improve maintenance:
1. Focus on Critical Assets
Not every piece of equipment needs the same level of attention. The P-F curve works best when you prioritize your most critical assets — those with no backups or redundancies that can’t afford to fail.
Start with an asset criticality analysis to rank your equipment. Tier 1 assets, like a conveyor system that moves your most important product, deserve full predictive and proactive maintenance. Lower-priority assets, on the other hand, may be better suited to simpler time-based methods or even run-to-failure strategies. When evaluating your approach, it’s important to remember that Tier 1 assets are those with no redundancies or backups and demand a full-blown reliability-centered maintenance strategy.
Once you’ve identified your critical assets, the next priority is getting the most out of your maintenance window. That’s where the P-F interval comes into play.
2. Extend the P-F Interval
Identifying potential failures early stretches the P-F interval and gives you more time to plan and act. This is where tools like vibration monitoring, thermography, and oil analysis come into play. Acting within this window of opportunity is critical, but the length of the interval isn’t static.
Potential and functional failure thresholds are defined by the operational context. For example, a pump rated to deliver 100 gallons per minute might have a potential failure point at 95 gallons per minute and a functional failure point at 90 gallons per minute. However, these thresholds can vary based on workload, environment, and other factors. A pump in one part of a plant may degrade differently than an identical pump in another area due to these variables. Tailoring your maintenance strategy to each asset’s context is essential for maximizing the P-F interval.
At the fault-directed end of the P-F curve — just above functional failure — you’re often dealing with incidental-based techniques, such as responding to operational work requests or visually spotting issues during rounds. For instance, if you walk by an asset with hydraulic components and see a hose that looks like a snake that just ate a rat, that means it has functionally failed. The steel belts inside the hose are no longer intact, leaving only the rubber to contain the pressure. “Clean up on aisle 12” is right around the corner. This underscores the importance of identifying potential failures earlier before reaching the fault-directed end of the curve.
Moving further up the P-F curve involves adopting predictive maintenance techniques, such as condition monitoring, to catch issues earlier in their lifecycle. Solutions like Azima DLI’s wireless vibration sensors and AI-powered diagnostics can predict failures months in advance, leading to up to a 10% increase in equipment life and a dramatic reduction — up to 90% — in Priority 1 and 2 faults.
But keep in mind that the ability to act earlier depends not just on the tools you use but also on how maintenance tasks are performed. Intrusive methods, which require taking equipment offline, often detect issues closer to functional failure. In contrast, non-intrusive methods, performed while equipment is operational, enable earlier detection and longer P-F intervals. Understanding the difference between these approaches is critical to making the most of your maintenance window.
- Intrusive maintenance: Requires taking equipment offline or disassembling it to perform inspections or repairs. Includes examples such as disassembling a motor to inspect internal components for wear. These methods often detect potential failures closer to the point of functional failure, shortening the P-F interval.
- Non-intrusive maintenance: Relies on monitoring techniques that don’t interrupt operations, such as using sensors to monitor motor vibrations while the machine is running to identify potential bearing issues. This allows for earlier detection and a longer P-F interval.
By prioritizing non-intrusive methods like vibration analysis or infrared imaging, maintenance teams can act earlier in the P-F interval, reduce downtime, and avoid the risks associated with more disruptive, intrusive maintenance tasks.
3. Match the Right Maintenance to the Asset’s Context
It’s important to remember that maintenance isn’t one-size-fits-all. The P-F curve helps determine whether to apply scheduled, reactive, or condition-based to each asset. Choosing the right strategy isn’t just about preference — it’s about understanding the failure mode, using the right process to best identify it, and then matching the right tool to the expected failure mode.
Simply using a tool like a thermal imager doesn’t mean you’re doing preventive maintenance. This is just one part of the job. You also have to consider ultrasound, vibration, motor testing, electrical testing, and oil analysis, depending on the asset and its condition.
Collecting machine health data and mapping it to the P-F curve is one of the best ways to do this. The asset’s original equipment manufacturer (OEM) is a great first source for that model’s most significant failure indicators. When OEM guidance isn’t available, failure analysis tools and techniques such as failure mode and effects analysis (FMEA), reliability-centered maintenance (RCM), the five whys method, logic trees, and data analytics can help map failure indicators to the correct maintenance activity.
Then, you can map failure modes to the P-F curve and use color coding to identify which maintenance techniques are most relevant at different stages. Early in the curve, data analysis and condition monitoring are represented by colors associated with predictive actions, emphasizing their importance in detecting potential issues. Closer to functional failure, colors indicating time-based measurements and inspections take precedence. While this process isn’t strictly linear, using colors to represent these stages helps ensure the team selects the right methods to gather data, improve inherent availability, and act effectively within the P-F interval.
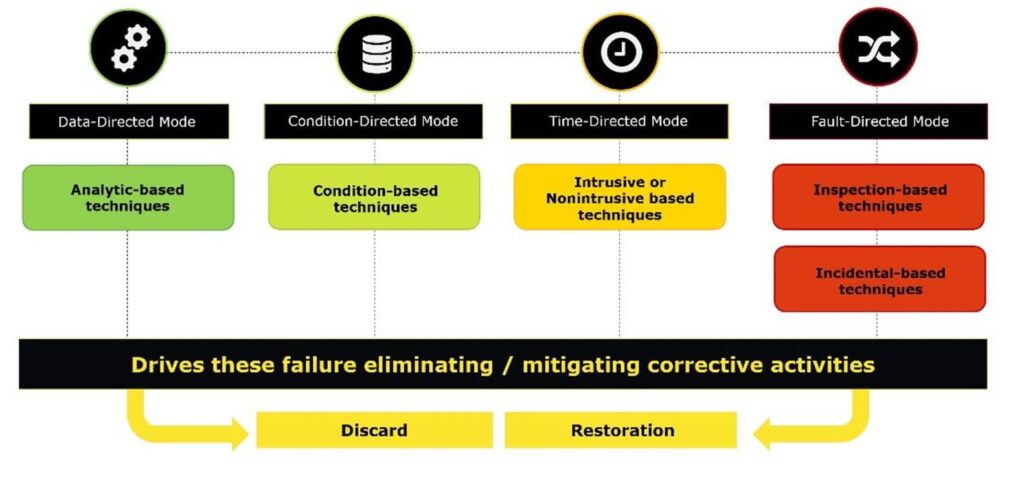
Once you have identified the stage that the asset is in, use these techniques to see which corrective activities are best to use, such as a scheduled discard (replacing a component) or scheduled restorative activities (repairing or refurbishing a component).
Making the P-F Curve Work for You
The P-F Curve is more about component failures at a micro-level and less about how an asset fails at a macro-level. Maintaining each asset requires a various assortment of failure modes and strategies deployed as corrective activities.
Maintenance strategies should comprise an optimized set of approaches defined by failure modes. These include run-to-failure, inspection-based maintenance, preventive maintenance, condition-based maintenance, and data-directed maintenance.
Think of every action you take within the P-F interval as a decision that shapes your operational future. By leveraging the curve, you’re not just prolonging the life of your assets — you’re transforming the way your team operates by prioritizing precision and foresight over firefighting.
Author bio: Greg Perry is the Senior Maintenance Reliability & CMMS Coach for Fluke Reliability.


